An in-depth analysis of the video game industry's transformation over 40 years, revealing fascinating patterns in consumer preferences, market dynamics, and industry evolution.
Executive Summary
My comprehensive analysis of the video game industry from 1980 to 2020 reveals a fascinating journey of growth, transformation, and market dynamics. The dataset encompasses:
16,291 unique video games
8.8 billion units in total global sales
40 years of industry evolution
Average sales of 540,000 units per game
The Anatomy of Success in Gaming
Breaking Down the Numbers
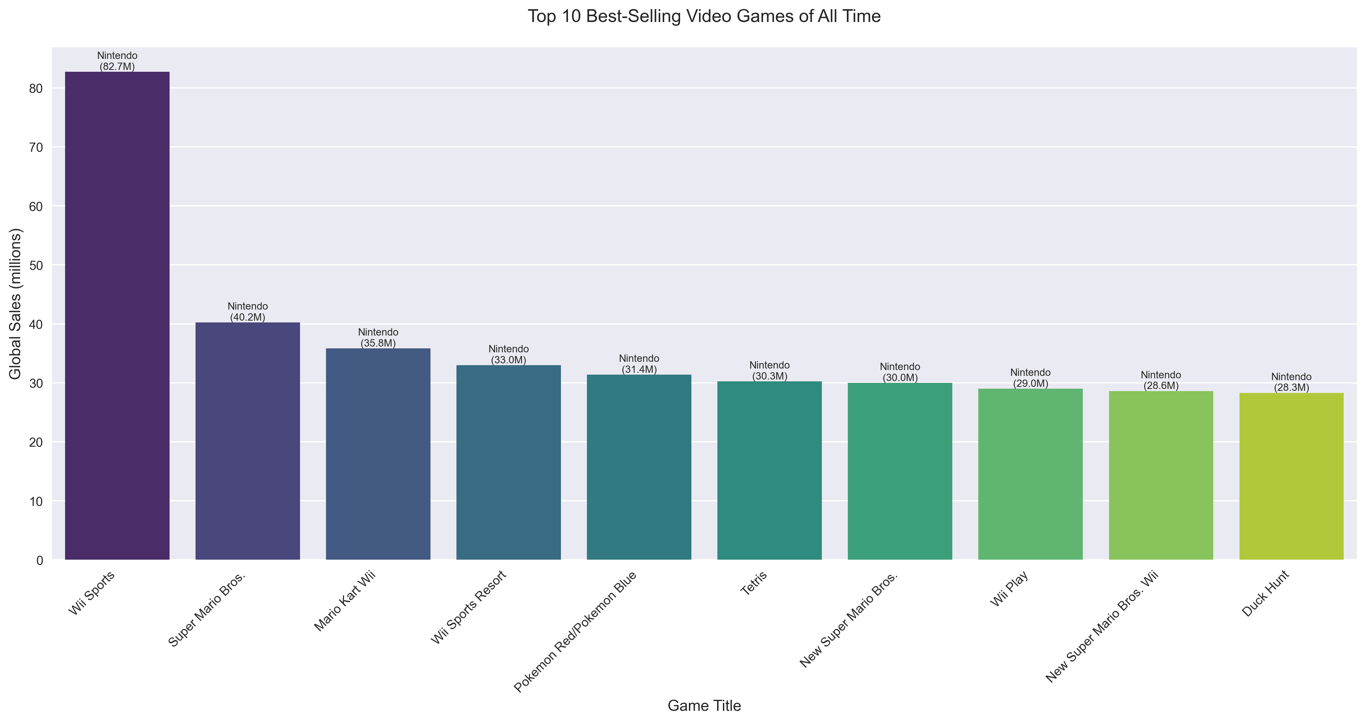
Only 12.5% of games (2,031 titles) achieve the milestone of 1 million units sold
An elite 0.4% (62 games) reach the prestigious 10 million units mark
The average game sells 540,000 units globally
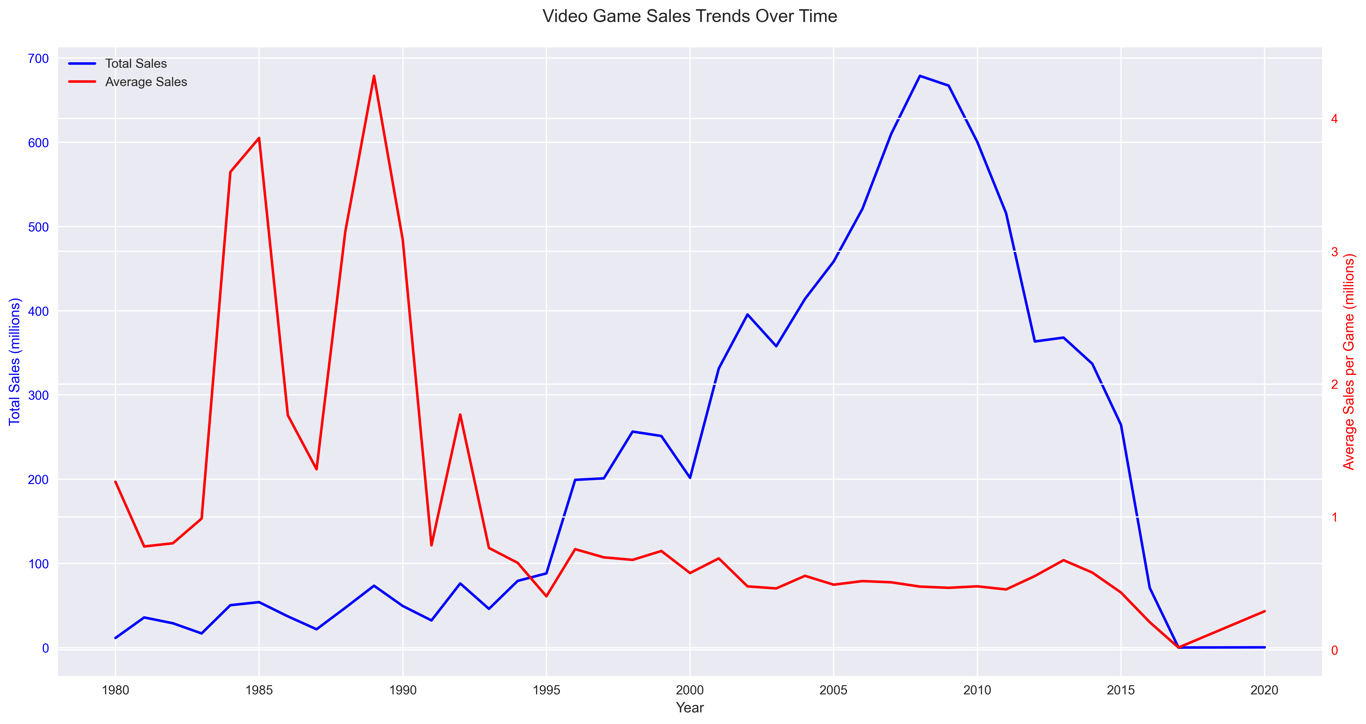
The Golden Era: 2006-2010
This period stands out as the industry's most successful, with unprecedented sales figures:
2008: 678.9M units (1,428 games)
2009: 667.3M units (1,431 games)
2007: 609.9M units (1,201 games)
2010: 600.3M units (1,257 games)
2006: 521.0M units (1,008 games)
This golden period coincides with several pivotal industry developments:
The maturation of the 7th generation consoles (PS3, Xbox 360, Wii)
The explosion of casual gaming through the Nintendo Wii
The rise of mobile gaming
The emergence of digital distribution platforms
Market Evolution Through the Decades
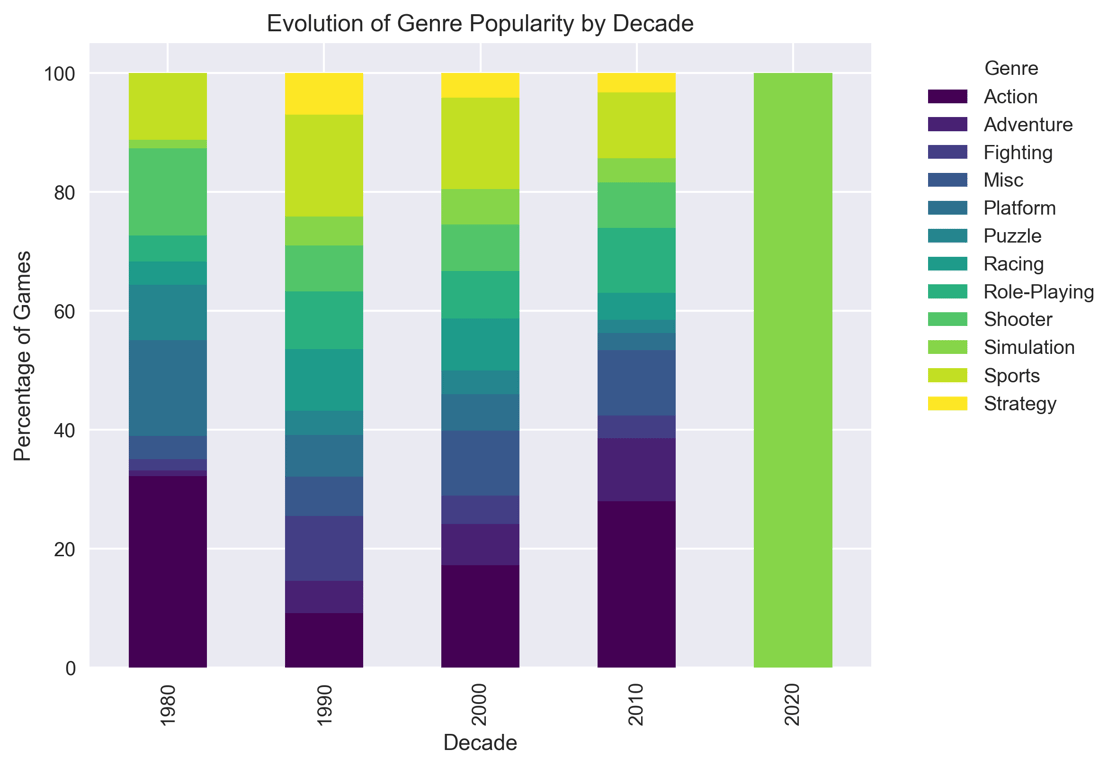
Genre Evolution
The transformation of dominant genres tells a story of changing player preferences:
1980s Top GenresPlatform Games (122.27M units)
Puzzle Games (62.73M units)
Shooter Games (59.79M units)
Why? Early hardware limitations favored simpler gameplay mechanics and clear objectives.
1990s Top GenresPlatform Games (208.91M units)
Role-Playing Games (184.52M units)
Racing Games (150.40M units)
Why? Improved technology enabled more complex gameplay and storytelling.
2000s Top GenresAction Games (858.91M units)
Sports Games (805.59M units)
Misc Games (479.83M units)
Why? Better graphics and processing power enabled more realistic and immersive experiences.
2010s Top GenresAction Games (673.46M units)
Shooter Games (462.80M units)
Sports Games (324.80M units)
Why? Online multiplayer capabilities and social gaming drove these genres' popularity.
Platform Wars and Market Share
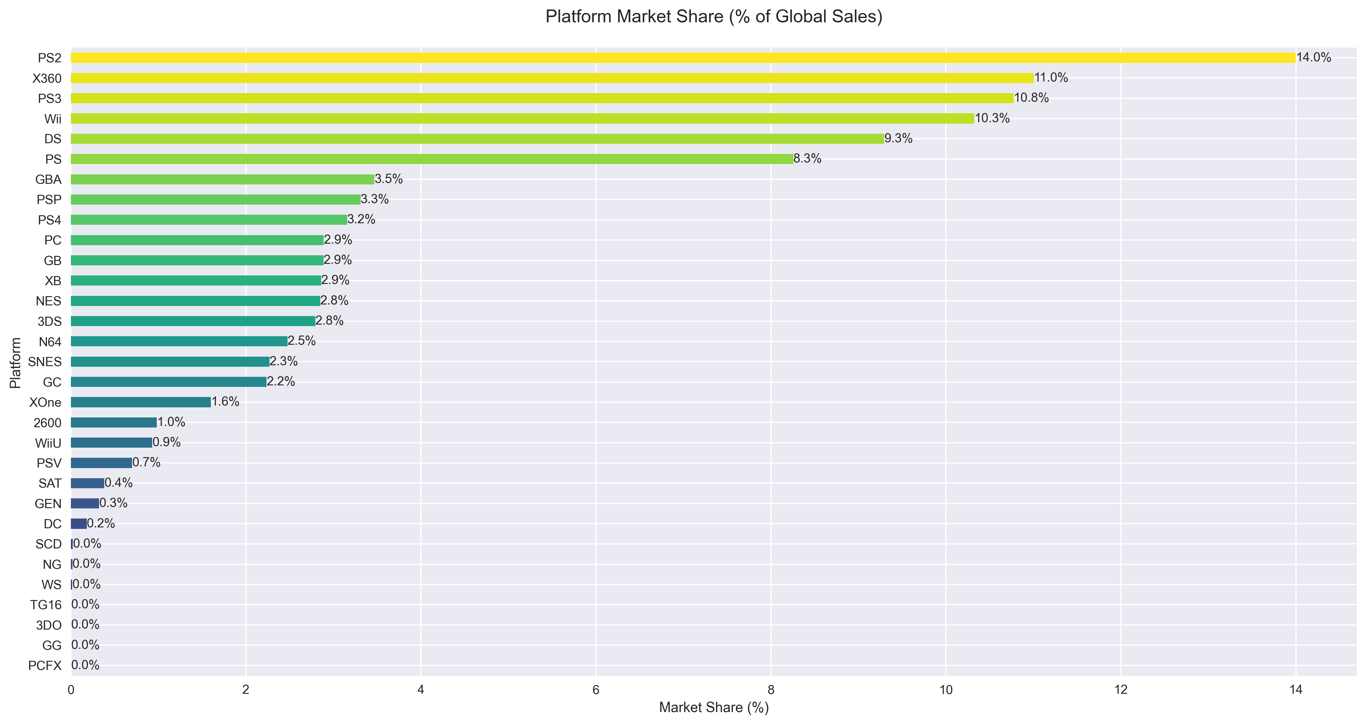
Top 5 Platforms by Total Sales
PlayStation 2: 1,233.46M units (2000-2011)
Xbox 360: 969.60M units (2005-2016)
PlayStation 3: 949.35M units (2006-2016)
Wii: 909.81M units (2006-2015)
Nintendo DS: 818.91M units (1985-2020)
Platform Lifecycle Analysis
Key observations:
The PS2's dominance (1,233M units) represents the peak of traditional console gaming
Nintendo DS's remarkable 35-year presence shows the endurance of handheld gaming
The Wii's success (909M units in 9 years) demonstrates the potential of innovative gaming concepts
Publisher Performance and Strategy
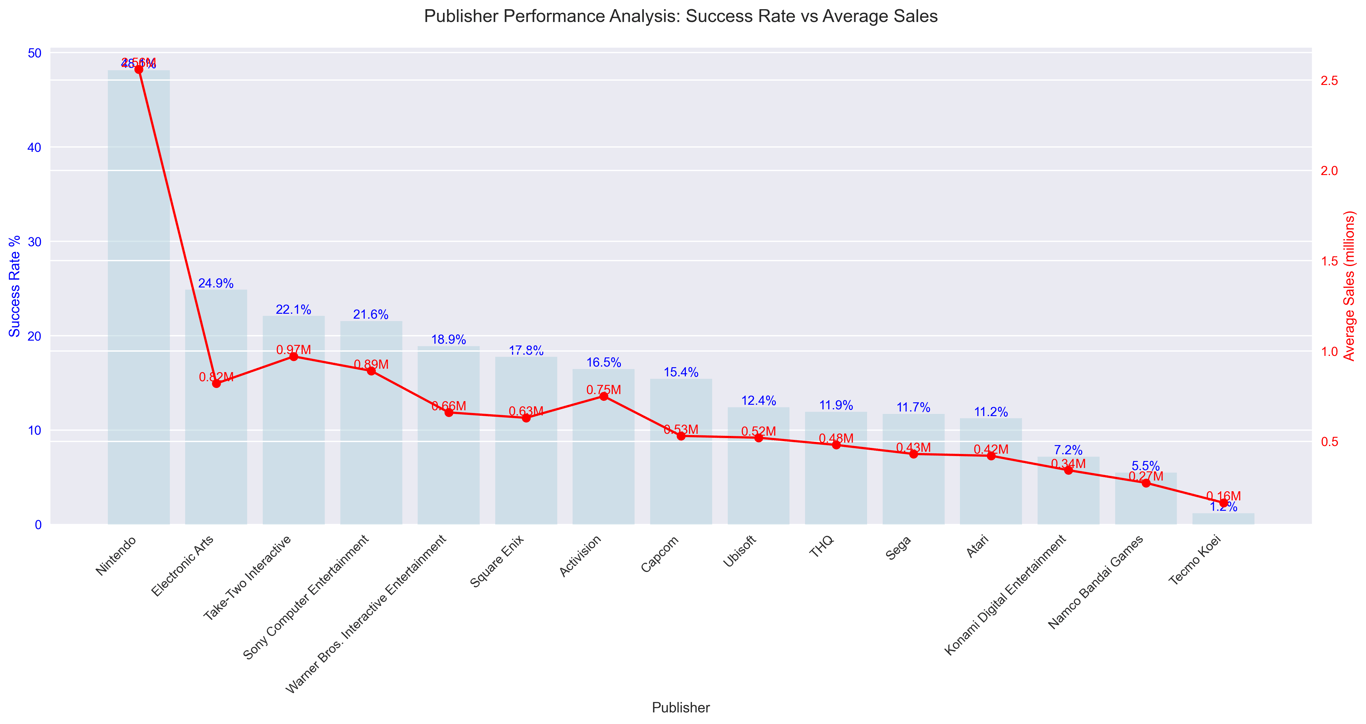
Success Factors
My analysis reveals several key factors that contribute to publisher success:
Portfolio Diversity
Successful publishers maintain a mix of reliable franchises and new IPs
Balance between high-risk, high-reward titles and steady performers
Market Timing
Launch timing relative to console lifecycles
Seasonal release patterns
Competition awareness
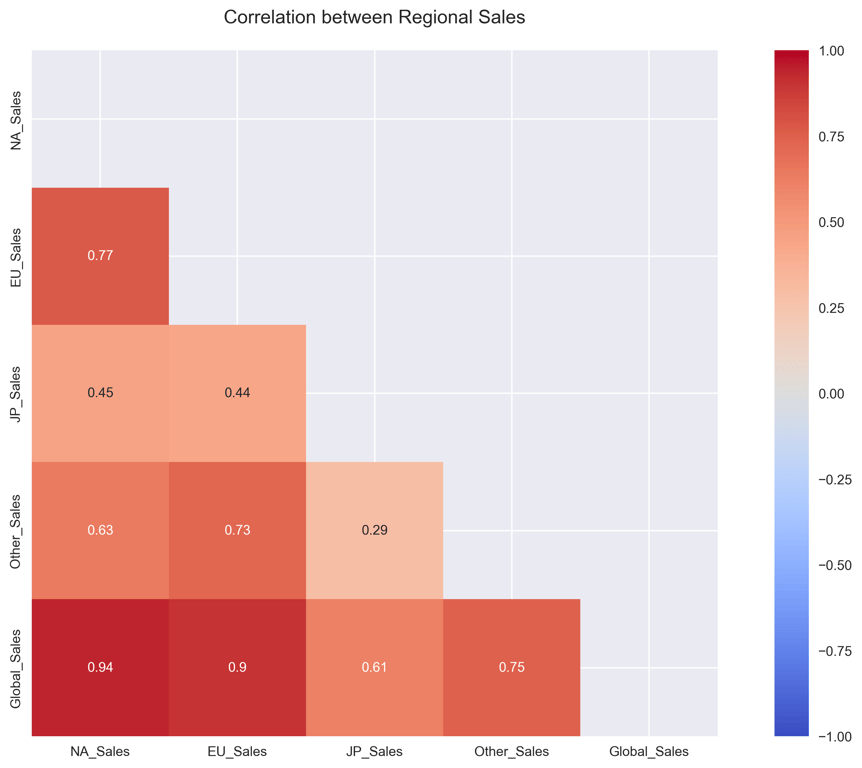
Regional Strategy
Different markets show distinct preferences
Successful publishers adapt their strategies for each region
Industry Trends and Future Implications
1. Market Concentration
The industry shows strong winner-take-all characteristics
Success is increasingly concentrated among top publishers
Blockbuster titles dominate sales
2. Platform Dynamics
Console generations typically last 5-7 years
Mobile and PC platforms show more stability
Cross-platform development is increasingly important
3. Genre Evolution
Action and Shooter genres dominate modern gaming
RPG elements are increasingly incorporated across genres
Mobile gaming influences casual game development
Methodology and Data Quality
This analysis was conducted using:
Python with Pandas for data processing
Matplotlib and Seaborn for visualization
Statistical analysis tools for trend identification
Data Considerations
Sales figures represent physical units sold
Digital sales are not fully captured
Mobile gaming data may be underrepresented
Conclusions
The video game industry has shown remarkable evolution over four decades, characterized by:
Increasing market sophistication
Growing importance of technology
Shifting consumer preferences
Rising development costs and risks
The future appears to be trending toward:
More digital distribution
Cross-platform integration
Games-as-a-service models
Increased importance of post-launch content
Note: This analysis is based on historical sales data up to 2020 and may not reflect current market trends. Digital distribution and mobile gaming have significantly impacted the industry since then.